I recently worked on a Flask based microservice at work. While everything worked normally for the first few weeks, a few heavy traffic days unleashed a critical bug I had introduced inadvertently during development. This post is a detailed analysis of what went wrong and how I debugged and fixed the issue.
The Background
I have been working with Python-based distributed systems with Gevent for concurrency for the last several years. However, I never got a chance to actually write a service that uses Gevent. Most of the services I have worked with were implemented by other teams and were in production for years before I started working on them. So, I never really got to experience writing a Gevent-based Python microservice from scratch. Recently, I got an opportunity to do just that. I was tasked with writing a new microservice that was to act as an email notification service for our platform. This service was replacing another service that belonged to a different product about to reach EOL.
Service Implementation
While I initially proposed using FastAPI for the new service, the team decided to go with Flask since most of our existing services were already using Flask. So, I started working on a new Flask-based microservice that exposed REST endpoints for the internal clients. Clients would call these endpoints with the request payload. The new notification service would process the payload and send email notifications by calling another downstream service over the network within the same K8s cluster.
For the discussion in this post, the service had following tech stack -
- Flask as the Web framework for implementing the business logic
- Gevent-based WSGI server as the Application server to handle HTTP requests
I used Jaeger for distributed tracing so that we could trace requests across multiple services. We tested it for a couple of days in our staging environment, and everything seemed to be working fine. The service was able to handle a decent amount of load, and the traces were showing up correctly in Jaeger.
Deploying to Production
After about two weeks of testing in staging, I came up with a phase-wise rollout plan for deploying the new service to different production clusters. I started by routing a small percentage of the traffic to the new service while keeping the rest of the traffic going to the old service. I monitored the service closely for any issues. I gradually increased the traffic to the new service in phases until all the traffic was routed to the new service.
Things were looking good until this point. In fact, the service didn't show any issues for the first few weeks. However, after about a month of running in the production environment, I started noticing some anomalies in the downstream email sending service. The email service started showing an abnormally high number of incoming requests from the new notification service. Initially, I thought that the clients were simply sending more requests than before. The email service started throttling requests from the notification service due to the high load. The Grafana charts were all showing a high number of HTTP requests being processed by the notification service and an equally high number of incoming requests on the email service side. However, the logs from the clients didn't show any increase in the number of requests being sent. This was puzzling.
Symptoms start appearing
The sudden increase in the load on the email service raised quite a few eyebrows. I started investigating the issue from the notification service side to ensure that we were not dropping any notifications meant for the clients due to email service throttling. The service showed high throughput meaning the service was processing a high number of requests – an indicator of good performance in general. However the client side didn't show a significant increase in requests to the notification service. Though the number of requests from clients had increased, it was not corresponding to the number of requests being processed on the server.
Another interesting observation was that the number of context deadline exceeded errors increased on the client. The clients were written in Golang and this error generally means that the requests were timing out. In fact, the client's http client was configured to timeout after 10 seconds. Once the timeout occurs, the client retries the requests. This was an important finding.
Another thing I observed was the lack of tracing spans on the server side. I was able to find traces showing requests going out from the clients, but the spans from the Flask app layer were missing. This indicated that the Flask app was not processing requests. But then, how were the Grafana charts showing increased throughput?
From the above findings, I was able to deduce a few things -
- The client throughput had definitely increased but it was not consistently high. The throughput would increase only during business hours.
- The client was getting timeouts from the server and hence it was retrying with exponential backoff. The client timeout was 10 seconds per attempt, with retries continuing for up to 10 minutes total (15-17 retry attempts).
- The server was showing high throughput but it was not enough to process all requests from the client within the 10s timeout window.
- The downstream email service latency was around 500ms which wasn't concerning.
So, in summary, the server was processing an unusually high number of requests but was still not able to process all the client requests. The client on the other hand showed a usual rate of requests in the logs (we didn't have any metrics on client side to show the outgoing request rate at that time) and high number of timeout errors.
Finally a breakthrough!
Since I was not seeing any Jaeger spans from the Flask framework side, I suspected that the requests were not reaching the Flask server at all and were timing out (but not dropped!) at the WSGI server layer itself. When the client reaches its timeout (10s), Go cancels the context and closes the socket by calling the close() syscall. While I didn't debug the TCP layer, I suspect the client sent RST packets causing an abrupt close. When a server receives a RST packet, any reads on the socket will result in connection reset by peer and writes will result in Broken pipe error. Gevent WSGI server catches these errors, logs them and then discards the response.
Here are two possible scenarios that were in picture during this issue:
Scenario 1: WSGI server read the entire request but Flask hasn't started processing
- HTTP request is already buffered in server memory
- Client RST doesn't affect buffered data
- When the greenlet runs, it processes the request normally
- Flask executes appropriate handler
- When trying to send response:
BrokenPipeoccurs - Gevent catches exception, logs warning, continues
- Work is done, but client never knows = ZOMBIE REQUEST
Scenario 2: WSGI server read the request and Flask started processing
- Client RST arrives while handler is executing
- Python doesn't check socket state during processing
- Handler completes normally
- When trying to send response:
BrokenPipeoccurs - Gevent catches exception, logs warning, continues
- Again a Zombie request : work done, client never notified
Since the requests already accepted by the server were not dropped even when the client sent an RST packet, every retry added more requests to the server queue. These were all duplicate requests! Flask was able to process all these queued requests eventually; along with bombarding the email service with additional duplicate requests as a side effect. That explained increased throughput on Flask and email service.
Since I was suspecting a high number of queued requests on the server side, I also decided to check the memory metrics for the Flask pods. And voila, I observed significantly increased memory usage on the pods. The CPU usage was moderate at about 50% usage consistently. But memory usage was above the 80% mark. In this process, I also found a minor bug in HPA configuration which prevented autoscaling on high memory usage. If the pods had autoscaled, the issue would not have come to light so quickly.
So, the high memory usage answered what was happening. My hypothesis was clear now - clients were sending a high number of requests, the Gevent WSGI server was accepting all these requests and spawning Greenlets to keep the requests in the memory. Flask was processing a high number of requests but it was still not enough to process all the Greenlets. Since some of the requests were timing out at the server layer, the client kept retrying the requests, adding to the load on the server.
But, why was the Flask app not able to process all the requests?
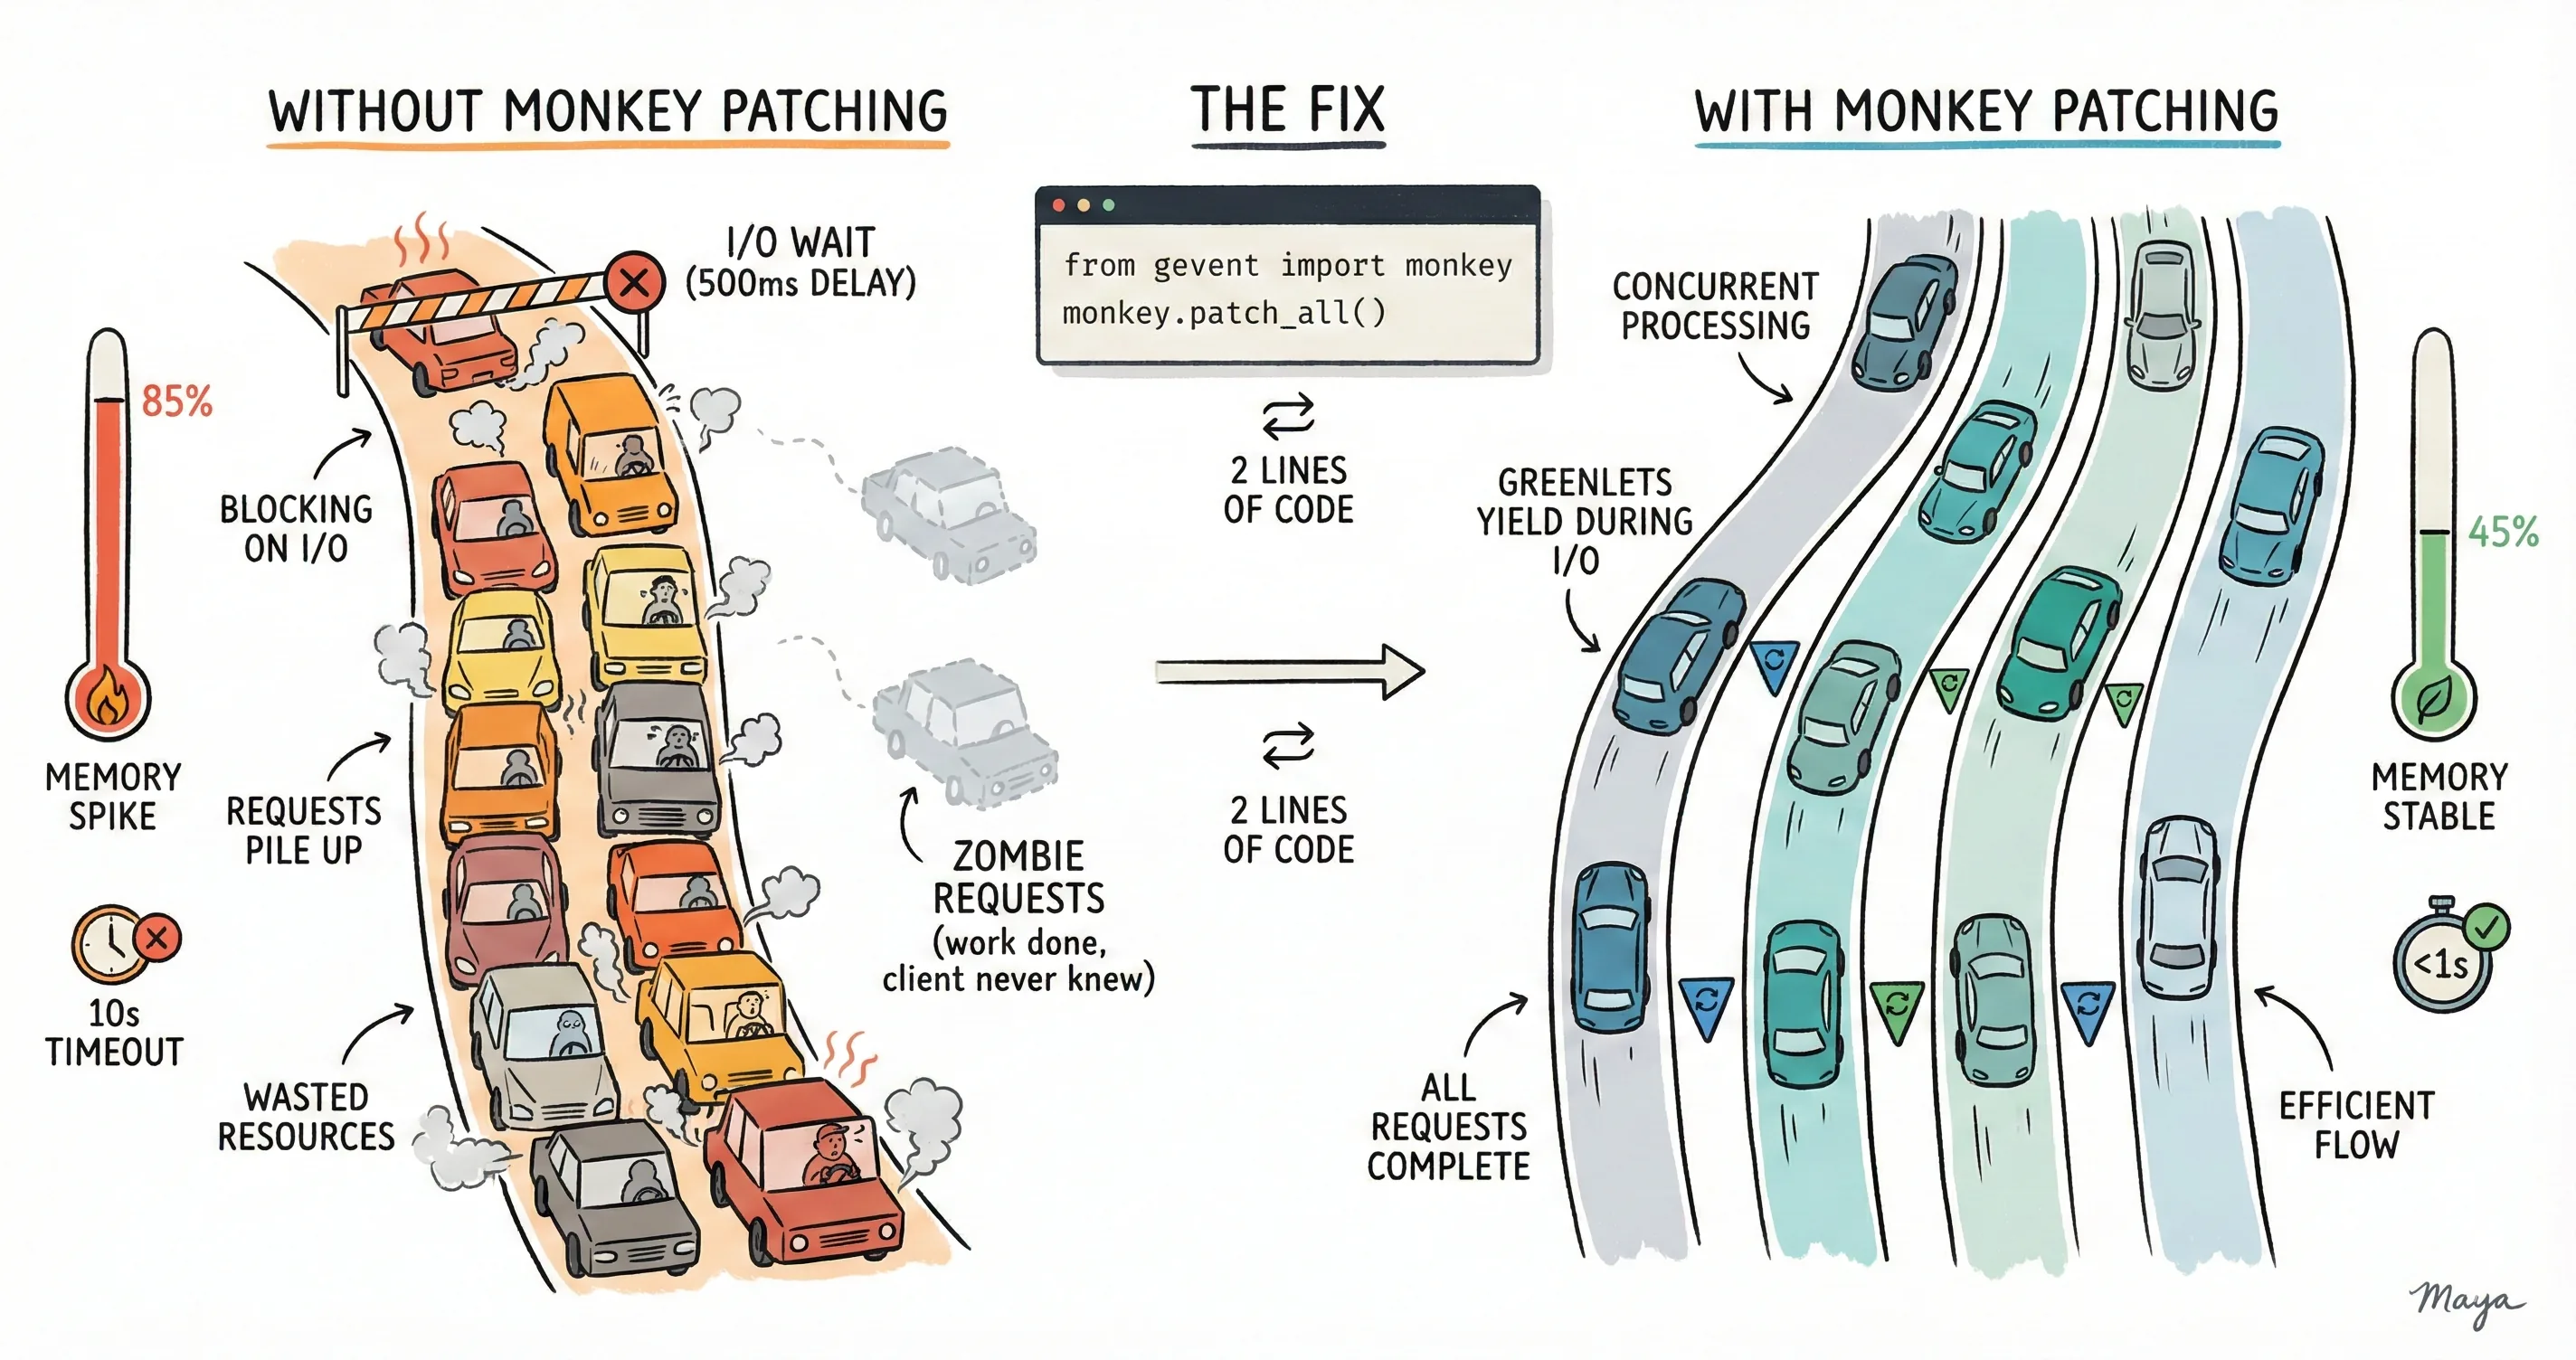
A tale of Python's single threaded nature, Gevent and monkey patching
Python is fundamentally single threaded due to GIL . Flask is also bound by this Python limitation. When a socket.recv() or requests.get() is executed, the entire process just blocks and does nothing until this I/O completes. This is particularly bad for web applications because the process can't handle more than one request at a time.
That's where Gevent shines. The solution is to use Greenlets instead of threads. Think of Greenlets as ultra-lightweight "pseudo-threads" that share the same OS thread. Instead of the operating system deciding when to switch between them ( preemptive multitasking ), Greenlets explicitly yield control to each other ( cooperative multitasking ).
Before talking about the actual fix, let's revisit our server configuration.
- I had a Gevent-WSGI server and a single threaded Flask web application.
- Under load, the WSGI server was able to accept multiple requests thanks to the Gevent event loop.
- Every time a new request came, Gevent spawned a new greenlet.
- However, since the Flask application was still single-threaded, it didn't know about Gevent's event loop or Greenlets. It still processed requests sequentially and blocked on I/O calls like
requests.get. - That meant no two Greenlets were able to call Flask simultaneously.
- This was evident from the memory charts (which spiked due to Greenlets in memory) and timeout errors we saw in clients (Greenlets were not able to process requests).
Here's where I messed up. I completely missed replacing Python's standard blocking I/O with Gevent-compatible versions during the development phase.
from gevent import monkey
monkey.patch_all()
The above code replaces Python's standard library at runtime . After it runs:
import socket→ You get Gevent's socket (non-blocking)import ssl→ You get Gevent's ssl (yields during handshake)time.sleep()→ Yields to event loop instead of blockingthreading.Thread→ Actually creates Greenlets, not threads
It's like swapping out the engine of a car while it's running. Sounds crazy, but it works.
This is what I earlier had in my main.py -
# No monkey patching here!

from gevent.pywsgi import WSGIServer
from flask import Flask, jsonify
import requests

EXTERNAL_API = "https://api.example.com/send-email"

app = Flask(__name__)

@app.route('/', methods=['POST'])
def send_email():
    payload = {}
    # Makes HTTP call to external API
    response = requests.post(EXTERNAL_API, json=payload)
    return jsonify({"status": "sent"}), 200

# Fire up the server
server = WSGIServer(("0.0.0.0", 9876), app)
server.serve_forever()
I was using WSGI from Gevent, so I thought I was good. Here's what actually happened when two requests arrived:
Request A arrives:
- Flask starts processing
- Calls
requests.post()to external API - BLOCKS on socket.send() (using
stdlibsocket!) - Entire server frozen for 500ms
Request B arrives while A is blocked:
- Connection accepted by Gevent
- Request read into memory
- Queued for processing (greenlet created!)
- But it is stuck waiting because A's greenlet won't yield

WSGI Server handles connection acceptance using Gevent's non-blocking event loop. But once the request reaches the Flask code and encounters a requests.post(), that uses the standard library socket, which blocks the entire greenlet.
Since there's only one OS thread and A's greenlet is blocked (not yielding), B's greenlet never gets a chance to run. It's like having an async server with a synchronous bottleneck.
This is the most non-trivial aspect of Gevent, and it caught me completely off-guard.
gevent.WSGIServer can accept connections without monkey patching because accept() uses Gevent's own event loop. So from the outside, it looks like your server is working. But then your application code blocks on stdlib I/O, and everything grinds to a halt.
Everything looked "normal" on the server side because the requests that did process completed in reasonable time. The problem was all the other requests timing out in the queue, which the metrics didn't capture.
How I fixed it
Adding just two lines of code fixed the issue. However, placement is critical. The monkey patching MUST happen before any other imports. Here's the proper way:
Add at the very top in main.py:
from gevent import monkey
monkey.patch_all()
The difference between "using Gevent" and "using Gevent correctly" was a single import statement that I had forgotten to add when setting up the service months earlier.
The Results
After deploying the monkey patch fix to production:
| Metric | Before | After | Improvement |
|---|---|---|---|
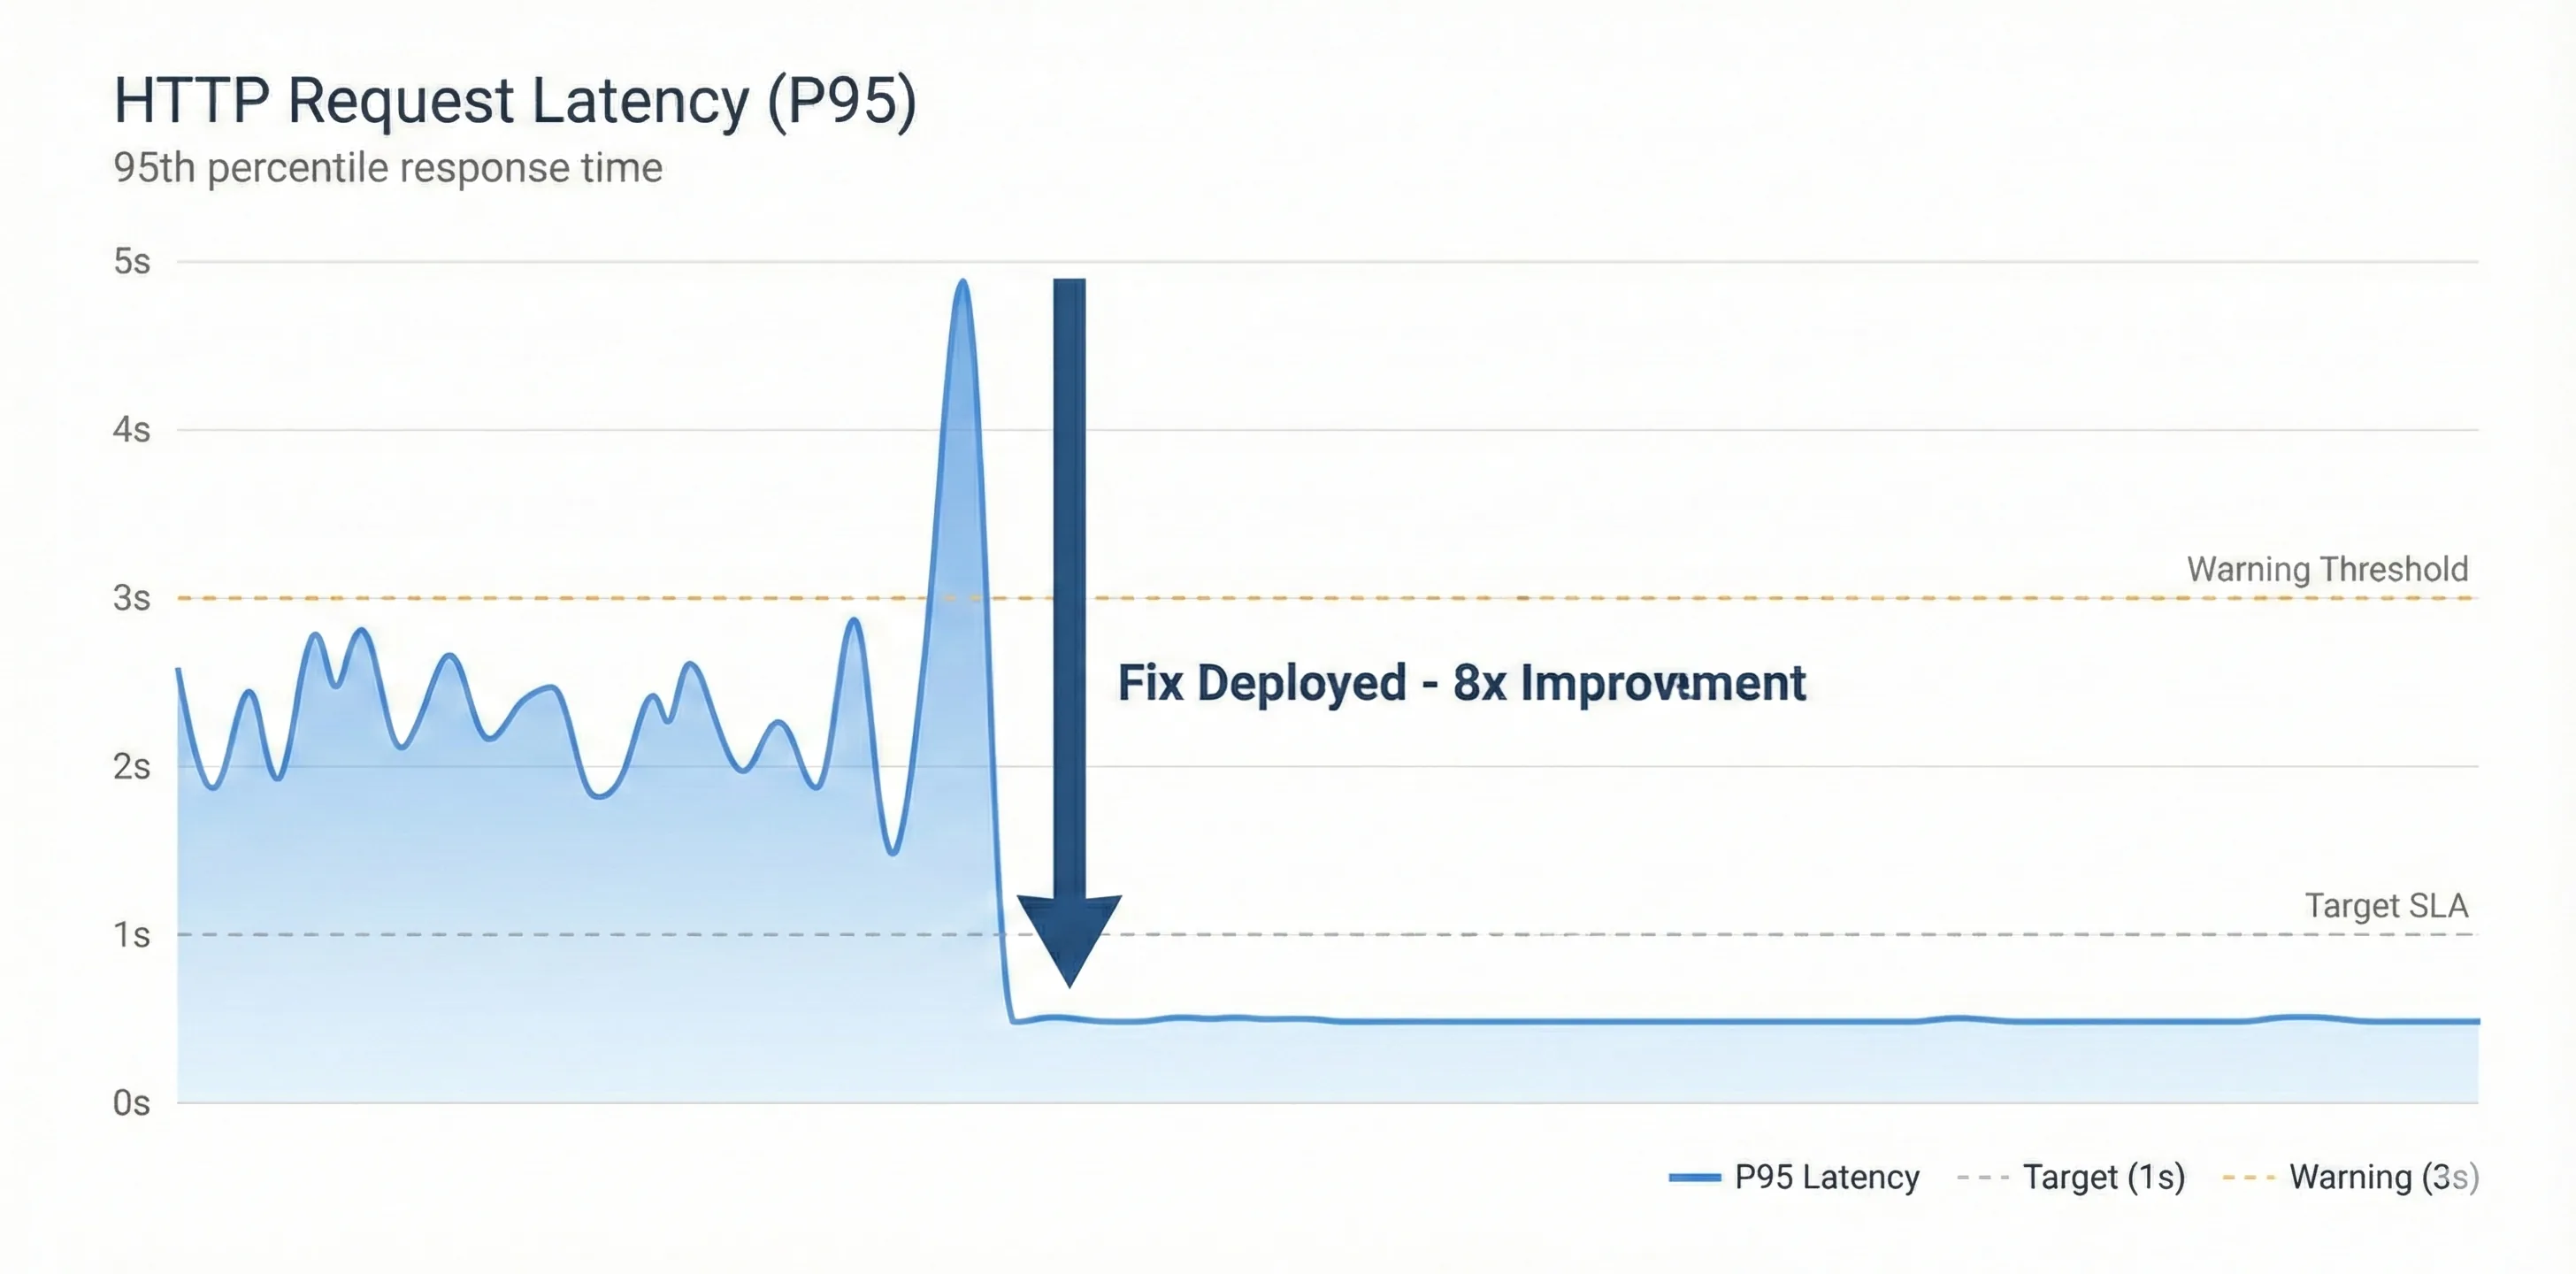
| P95 Latency | ~8-10s | ~500ms | 15x faster |
| Request Timeout Rate | ~30% | < 0.1% | 300x reduction |
| Memory Usage | 85% (growing) | 50% (stable) | Stabilized |
| Client Retry Attempts | 15-17 per request | 0 | Eliminated |
| Email Service Load | 700 req/min | 30 req/min | Back to normal |
| Requests processed | 2000 req/sec | 50 req/sec | no retries anymore |
The fix went live during a low-traffic window. Within 15 minutes, timeout errors dropped to near-zero.
All services immediately showed the significant impact of the fix. Once new pods came up, they didn't show the earlier trend of steady memory increase. Memory usage remained consistent for several days after the fix. Request latency also dropped significantly since the email service was no longer overwhelmed with duplicate requests.
Image unavailable Image unavailable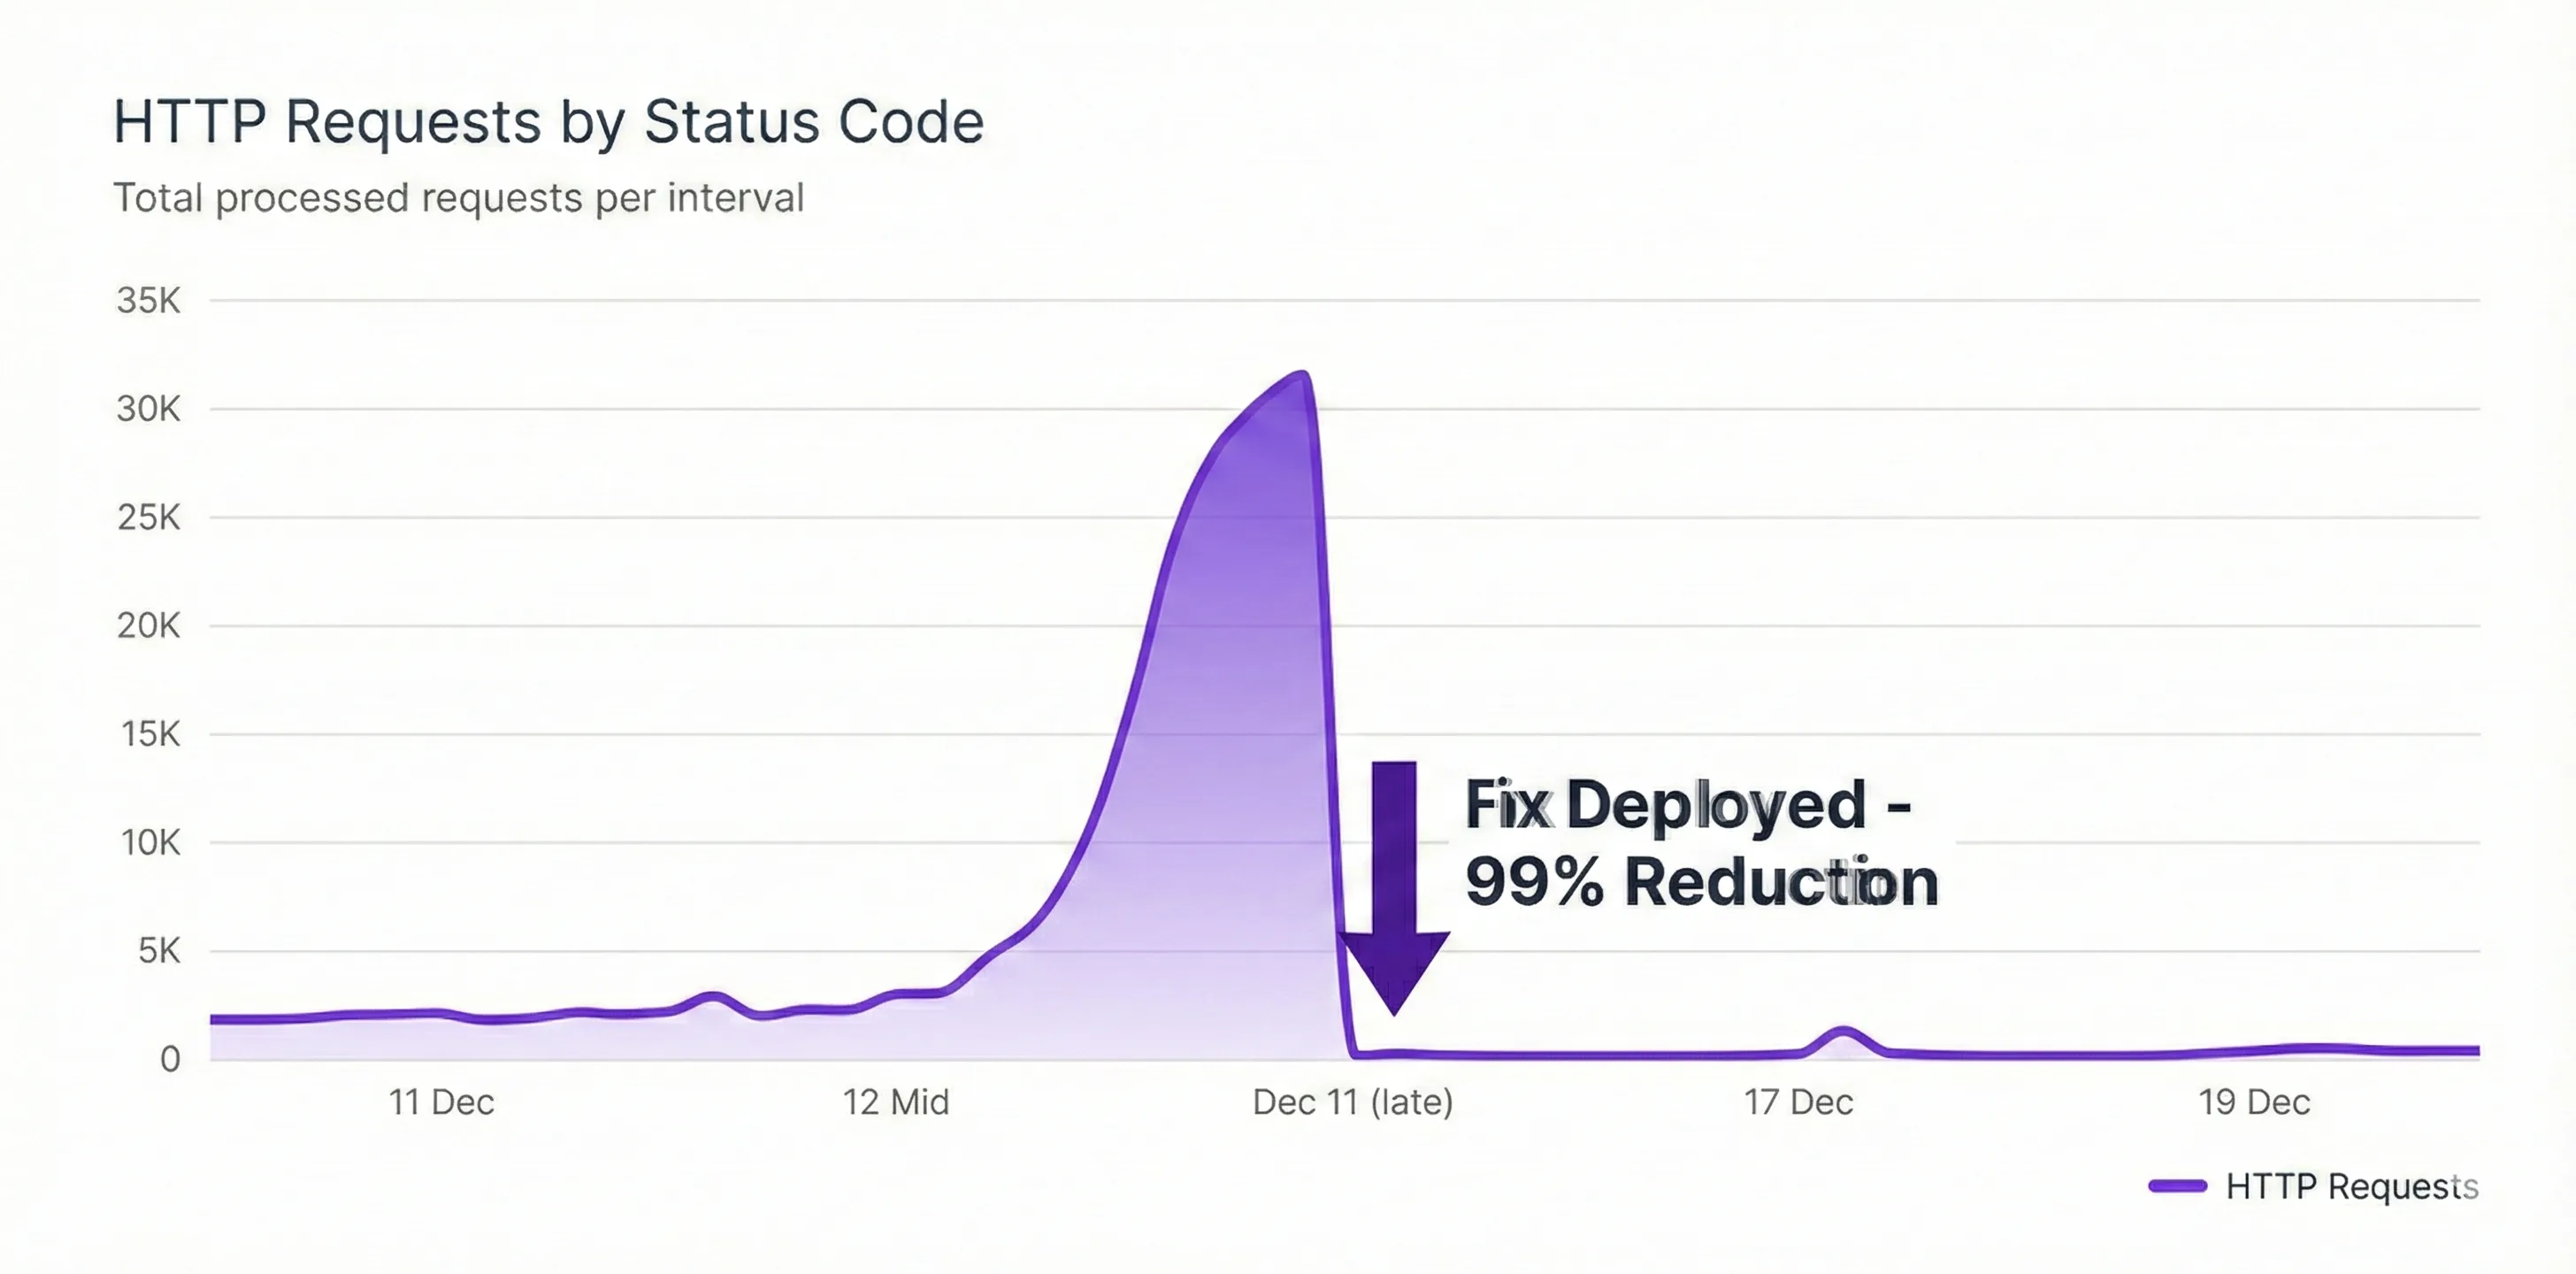
Email service incoming request rate also showed a similar trend.
Image unavailable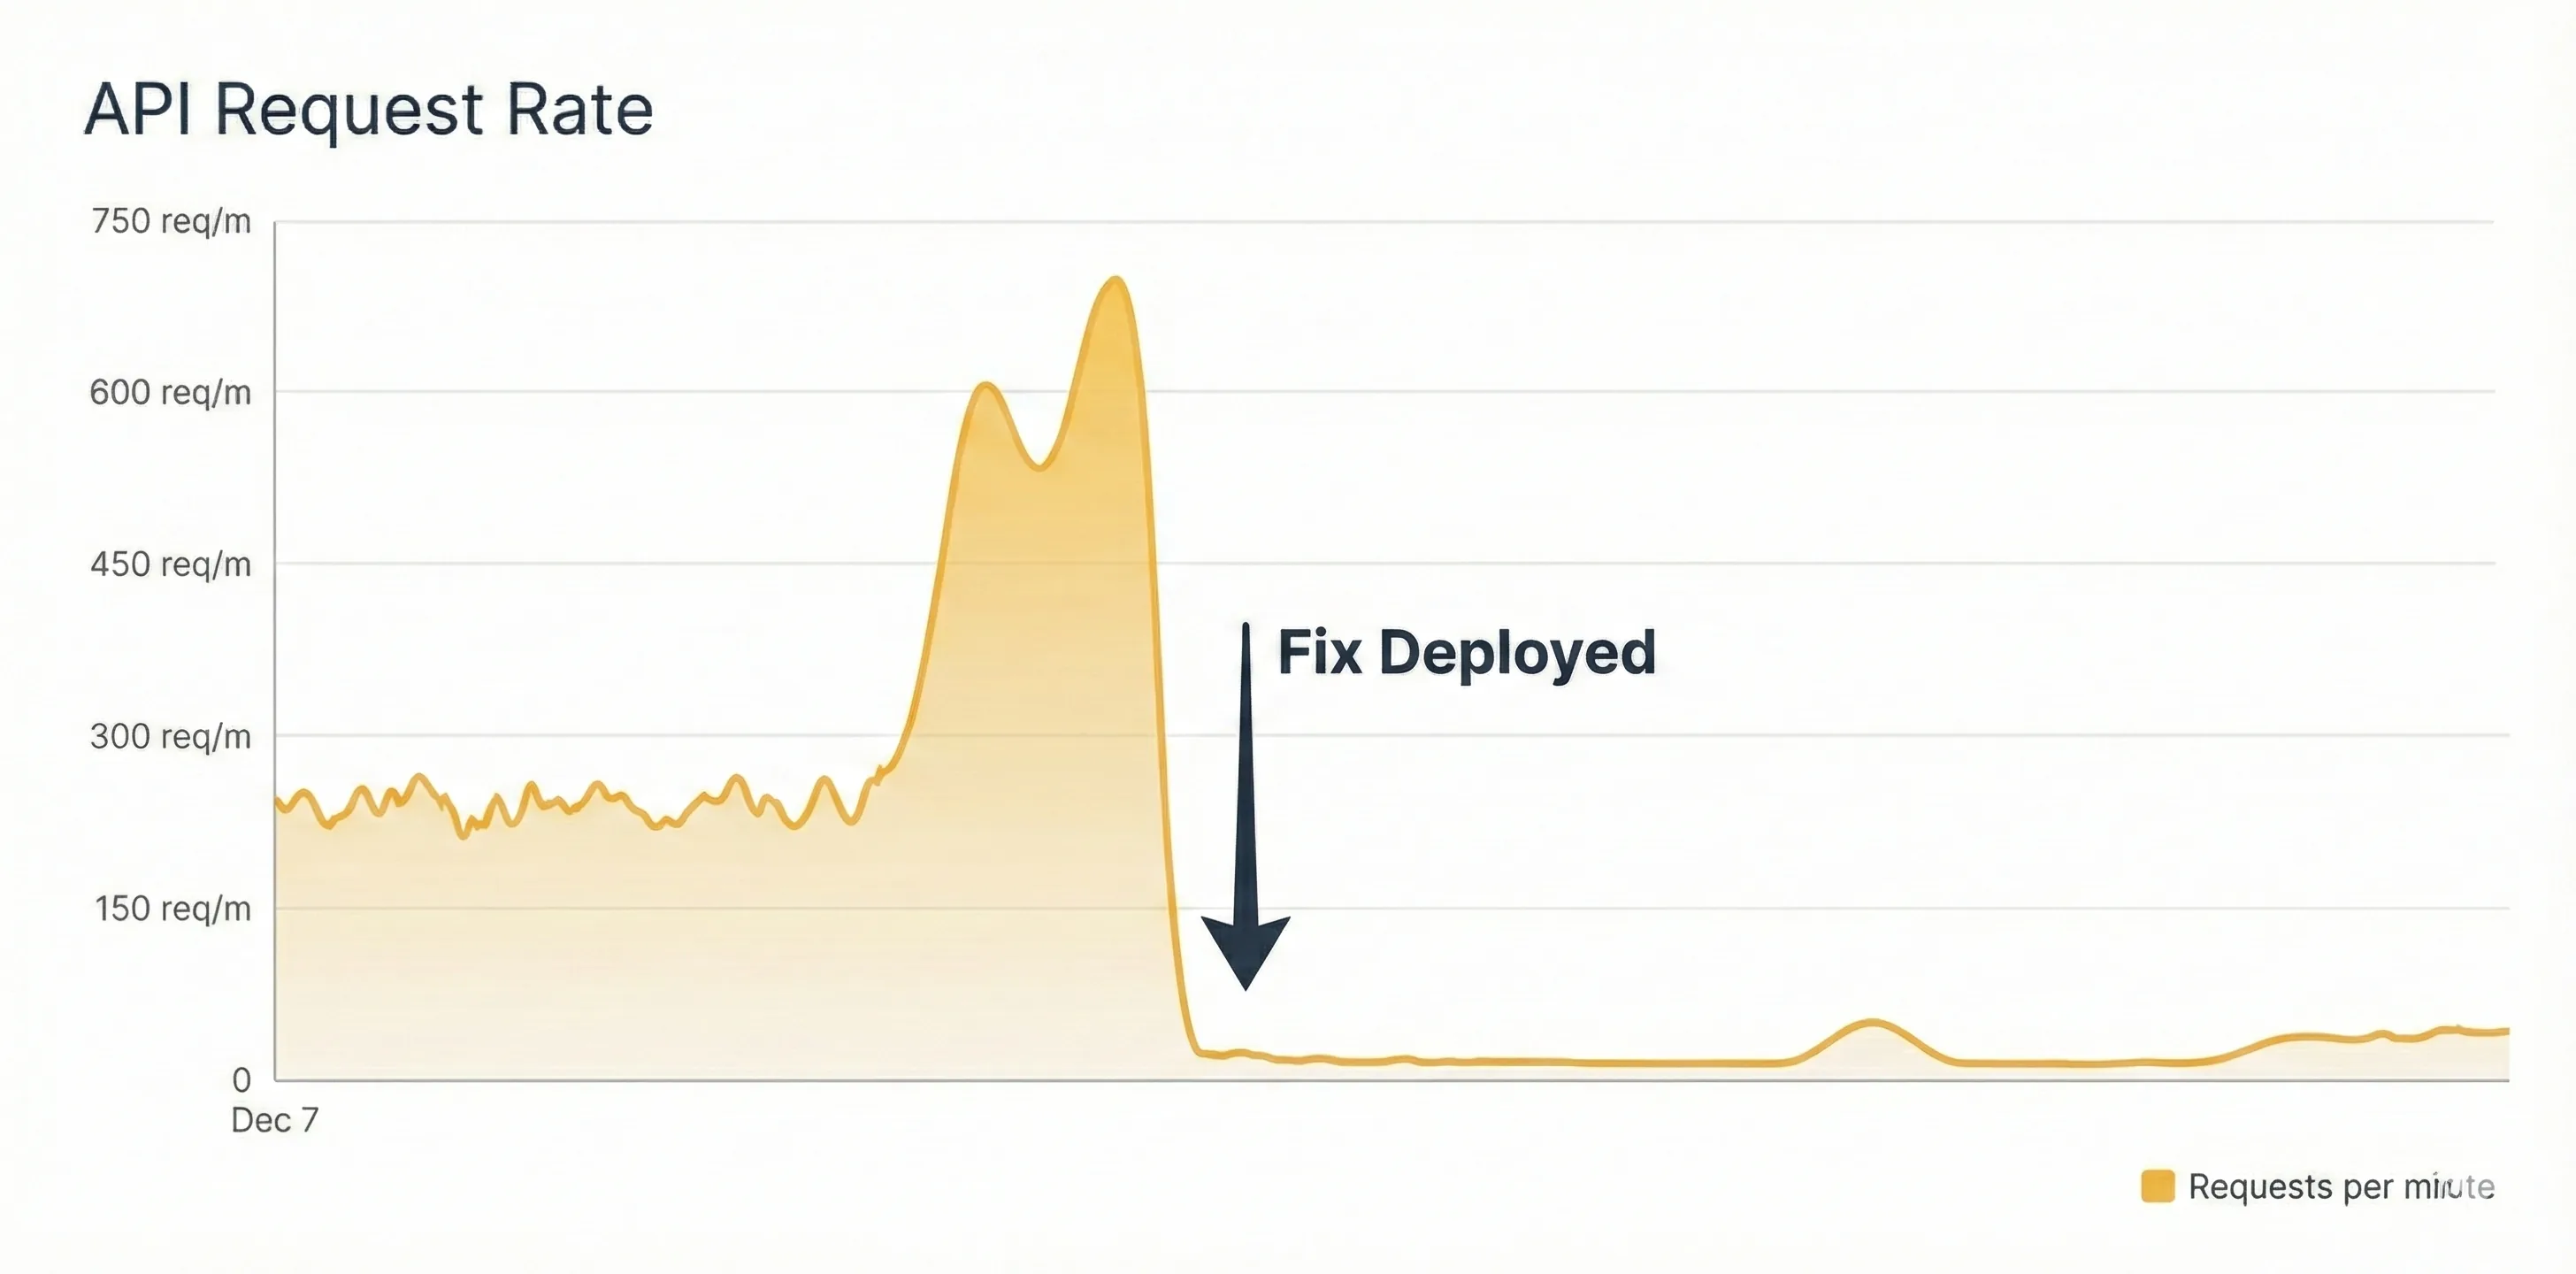
Lastly, the memory usage pattern of the Flask pods stabilized completely. The HPA bug I found earlier was also fixed during this deployment. The pods no longer showed increasing memory usage over time.
Image unavailable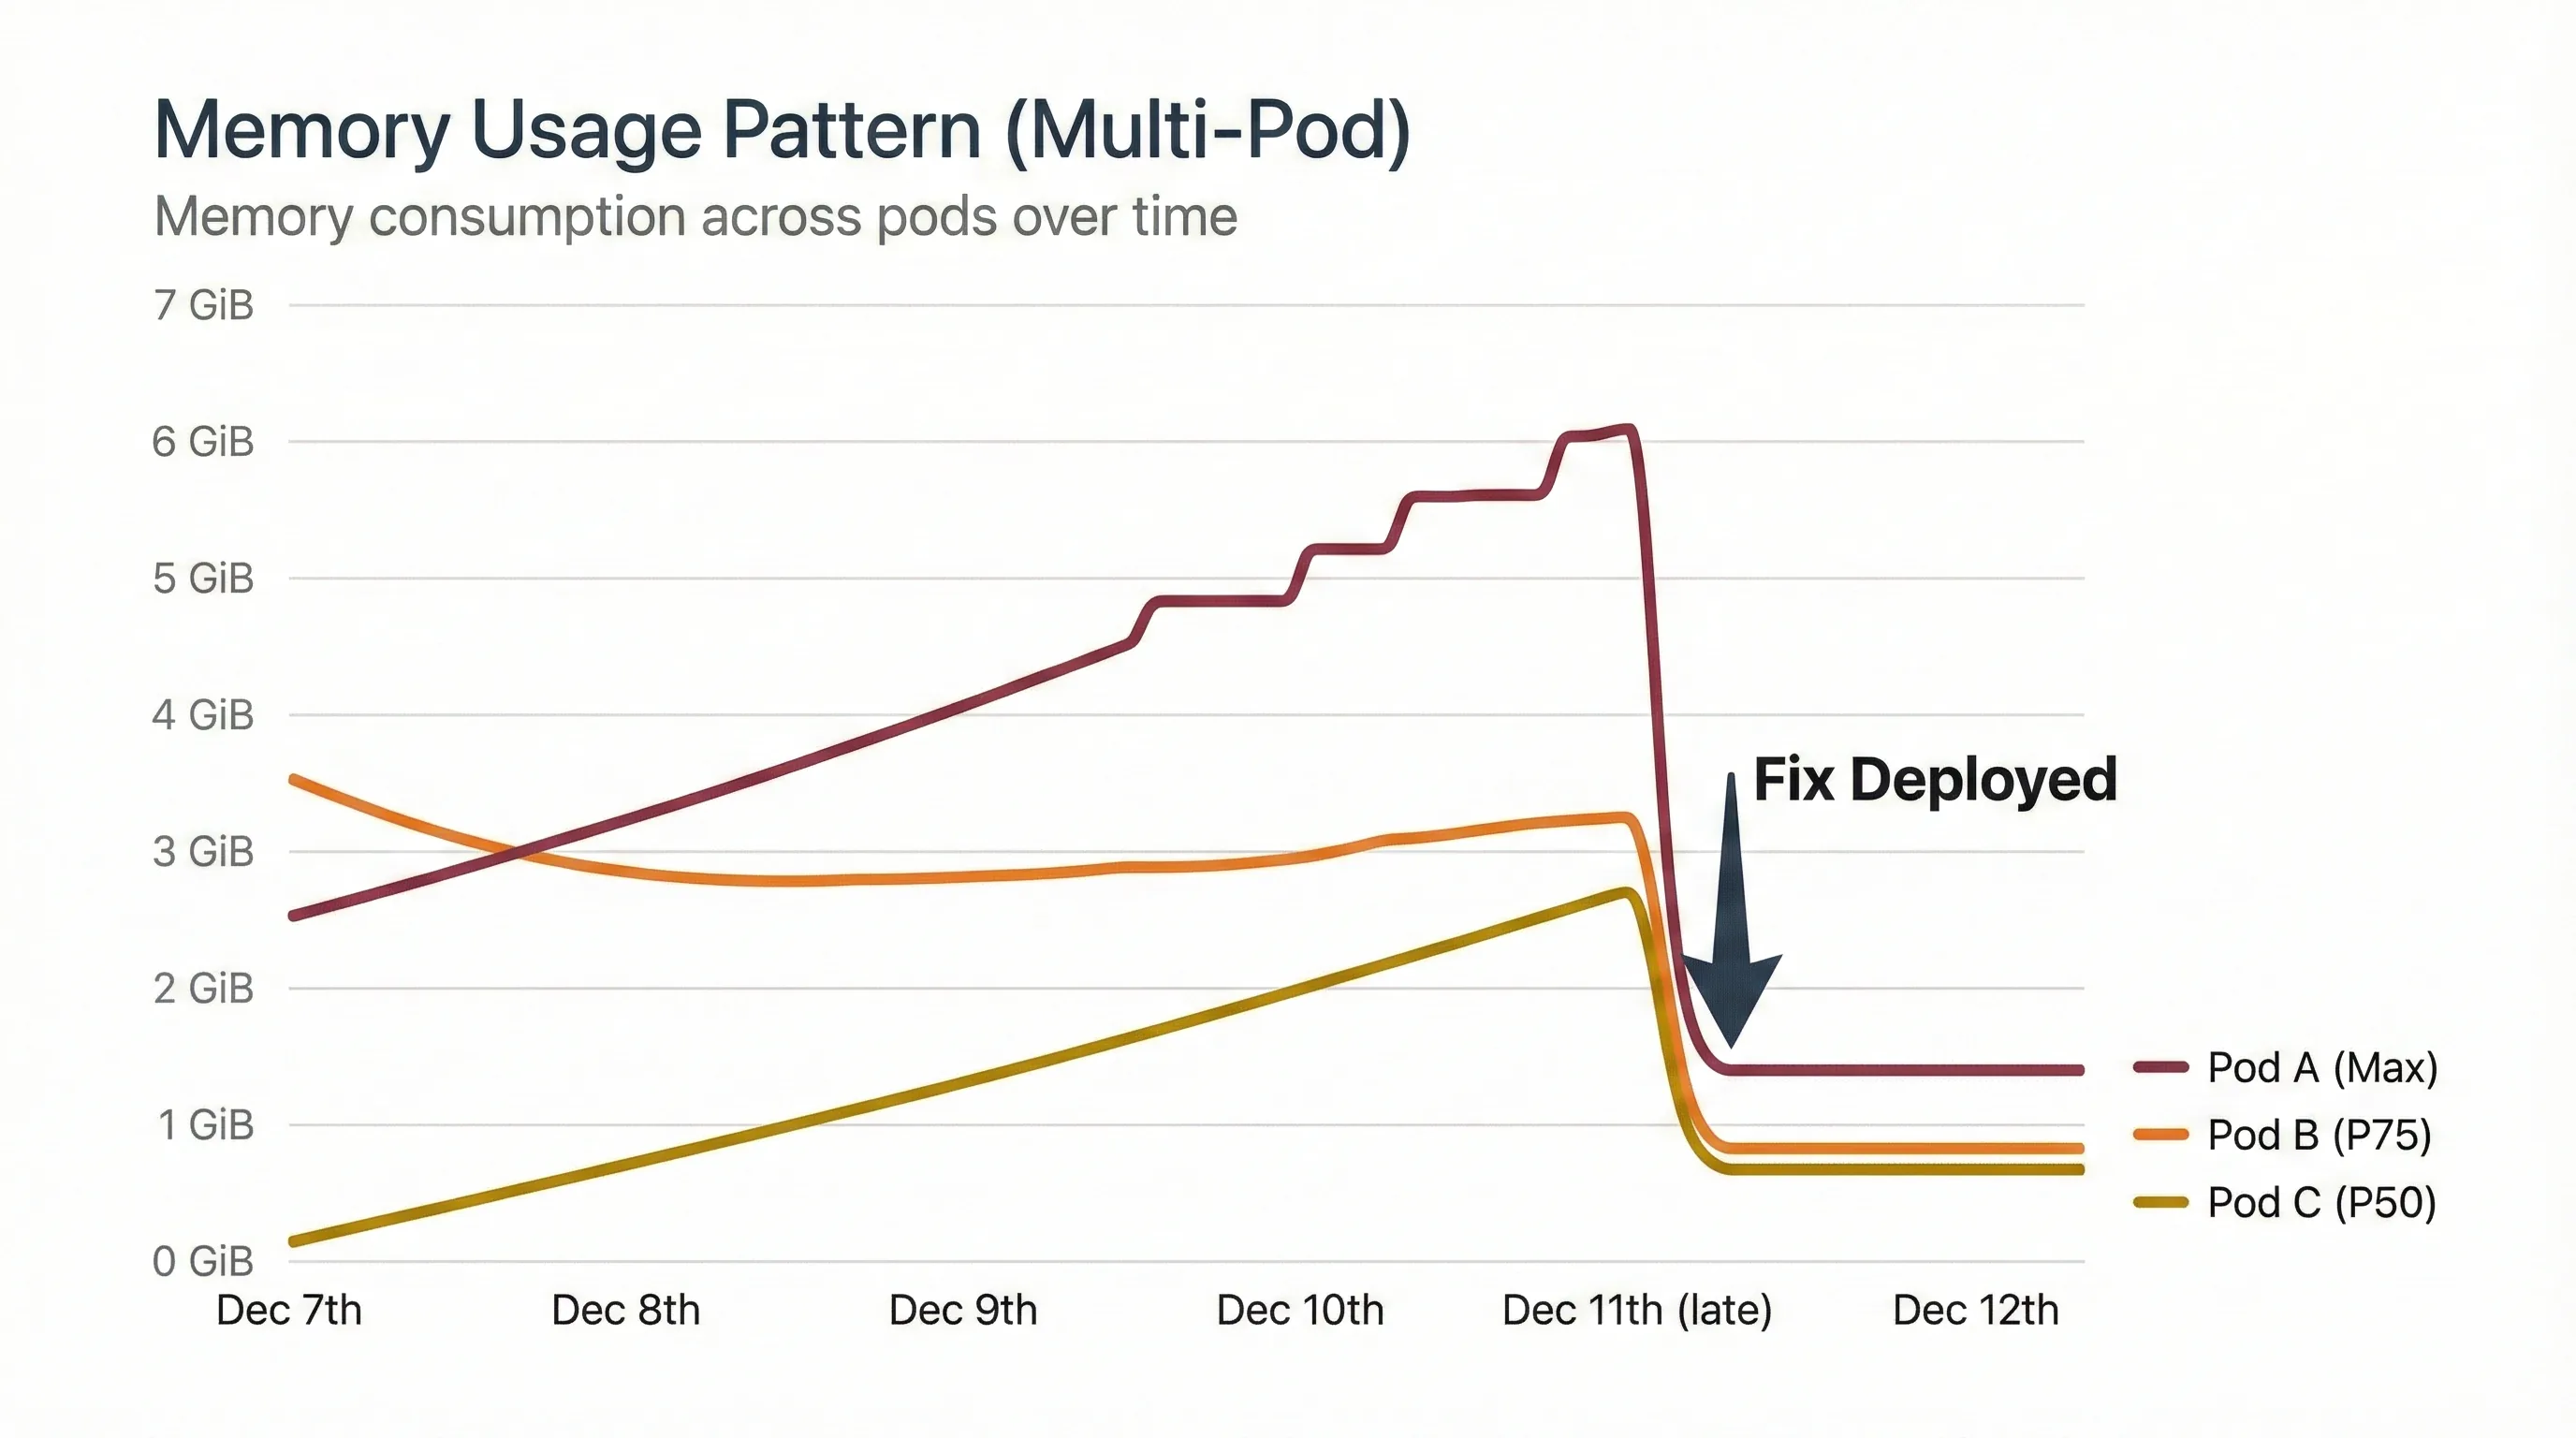
What I Learned
This bug taught me that understanding your framework's internals isn't optional – it's essential. I thought I was using Gevent because I imported gevent.pywsgi. I wasn't. I was using Gevent's connection handling with Python's blocking I/O, getting the worst of both worlds.
The three biggest lessons:
- Read the docs thoroughly - Gevent's documentation mentions monkey patching on the first page. I skimmed it.
- Question your metrics - When client and server metrics don't match, dig deeper.
- Distributed tracing is your friend - Missing server spans pointed directly to the problem.
The fix was embarrassingly simple. The debugging was not. But that's software engineering – sometimes the smallest oversights create the biggest problems.
And now I have a great story for "Tell me about a time you debugged a tricky production issue" question during interviews.